
Author: Smarika Thapa
Analyse information, gain better insights and make appropriate decisions with Dynamics 365 for Sales. Multiple analytical option in D365 for Sales helps you drive business decisions that are based on past sales numbers and trends.
This blog explains how you can work with analytical options in Sales available in Dynamics 365.
Here are some of the most common tools available to analyse data:
1.Advanced Find Functionality
The advanced find functionality allows you to create custom queries that find specific records as you’ll as extract data from the Microsoft Dynamics 365 for Sales database.
2. Reports
Reports are an organized way to display specifics of information. There are several pre-configured default reports you can use to track important aspects of sales management.
3. Microsoft Office Excel
Microsoft Office Excel allows you to export information to Excel as a static worksheet, dynamic worksheet, or as a dynamic pivot table. You can then use Excel’s capabilities to manipulate the data and perform complex analysis. Additionally, users have the option to use Excel Templates.
4. Lists and Views
Lists and Views entity in Dynamics 365 will have several predefined list and view associated with them. Lists and Views provide different options for filtering and sorting data to provide more specific analysis of information.
5. Charts and Dashboards
Charts present a visual display of information from a specific view of a Microsoft Dynamics 365 for Sales record type. Individual users and managers can create charts that can be consumed for personal use. Whereas, Dashboards can display one or more charts, for several different record types, and can also combine information from custom HTML pages, external websites and other resources.
6. Power BI Dashboard
With Power BI it is possible to connect to hundreds of data sources, simplify data preparation, and drive ad hoc analysis. Using the tools provided in Power BI you can produce reports, publish them for your organisation to access on the web and across mobile devices.
Let’s look at an example for one of the analytical options i.e. ‘Reports’:
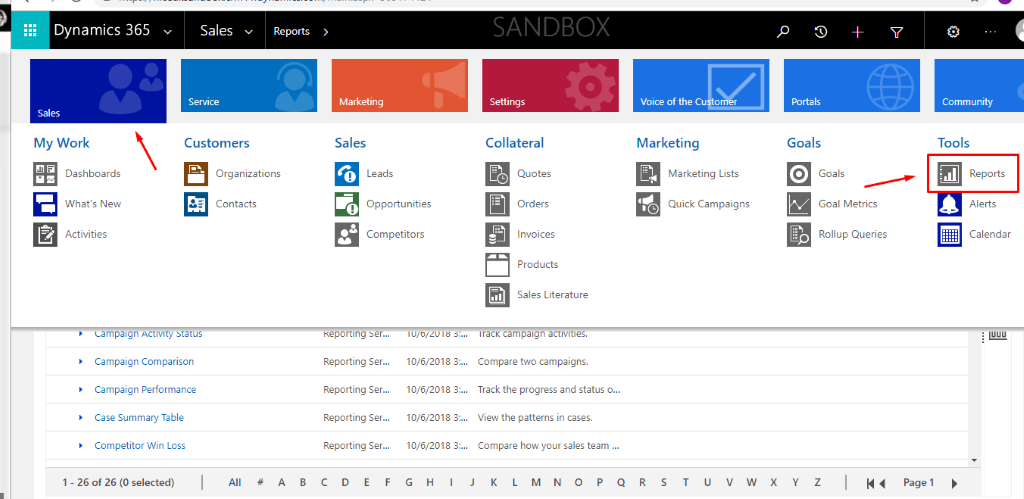
Step 1: Go to Sales application, click on Reports
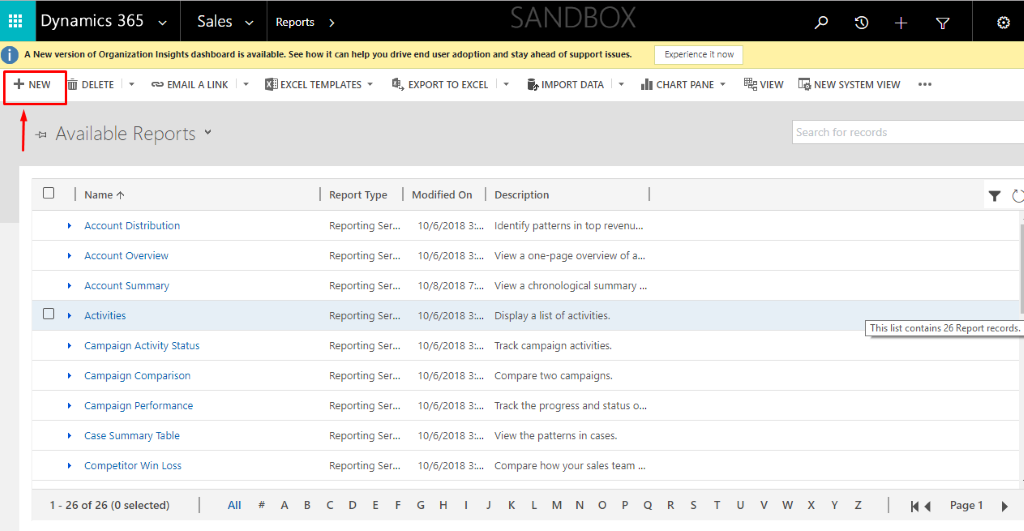
Step 2: Create a new report
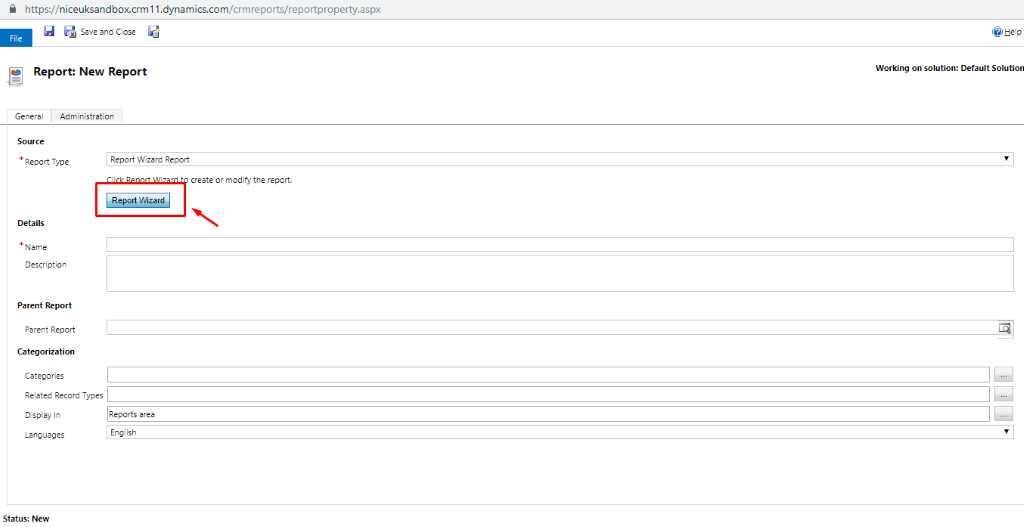
Step 3: Click on Report Wizard
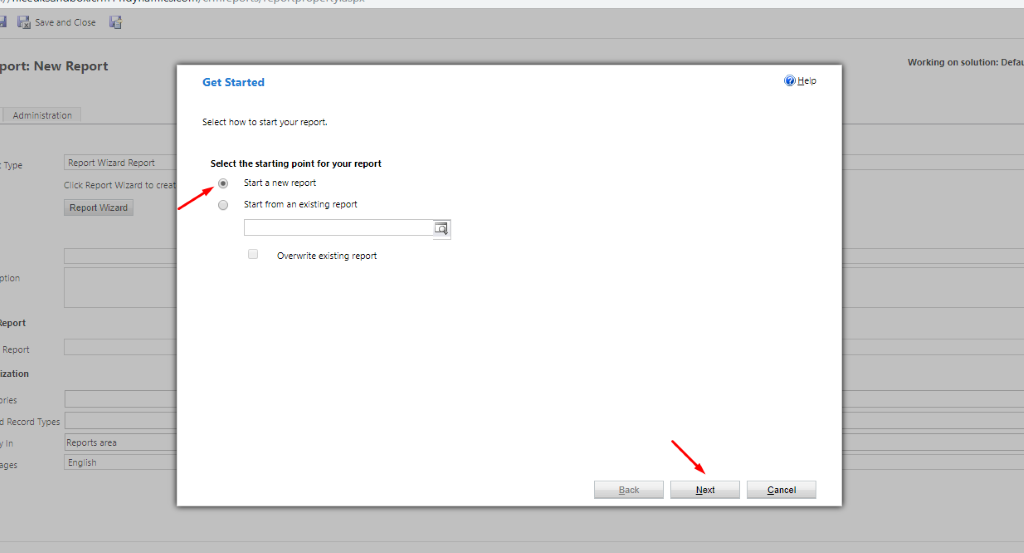
Step 4: Select an option to get started, click Next
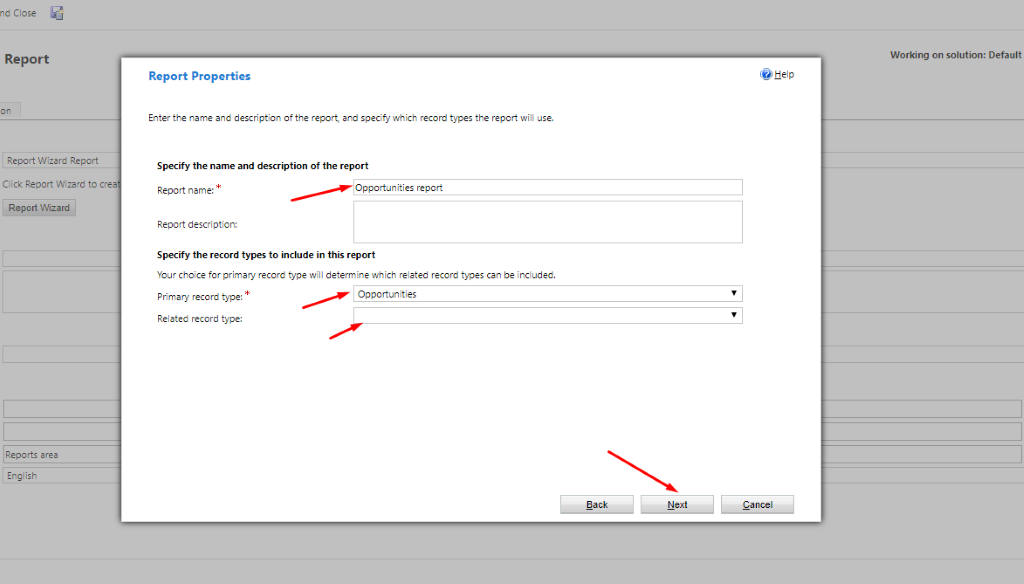
Step 5: Name the report that you want to create and select an option in primary record type and related record type. Then click on Next.
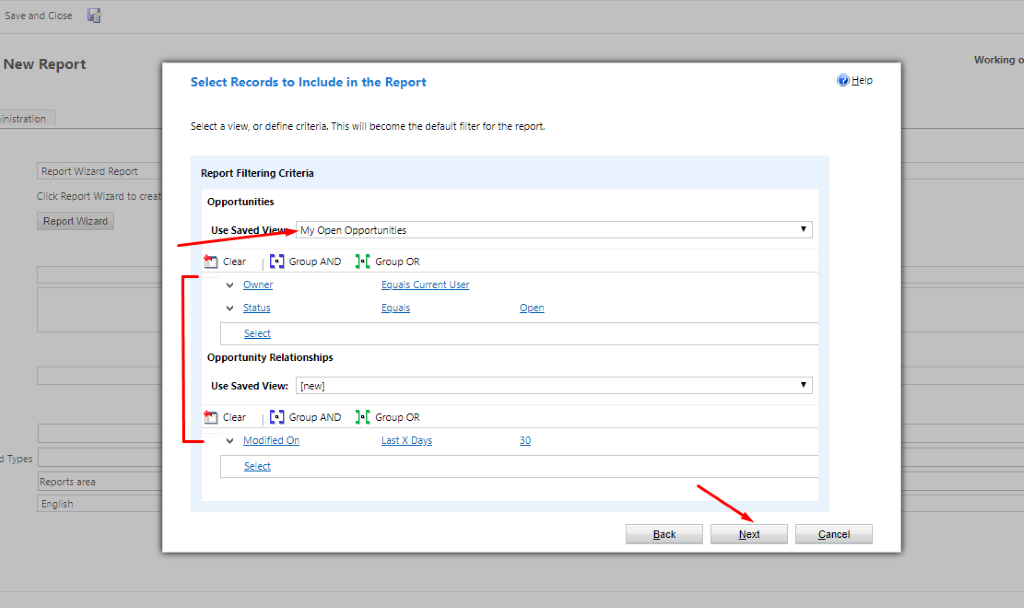
Step 6: You need to provide filtering options to display information as per your requirement.
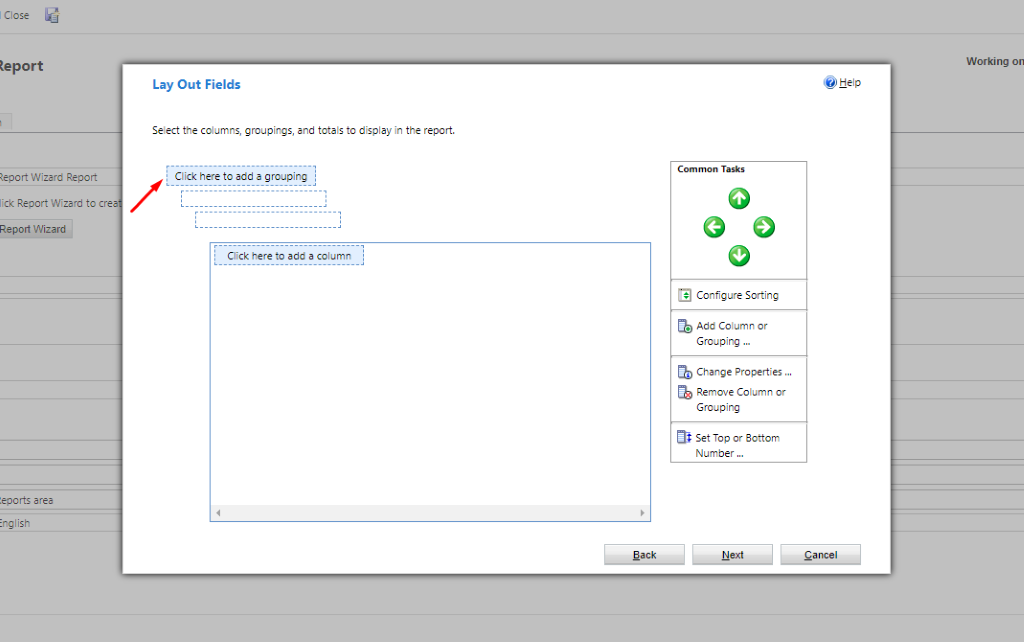
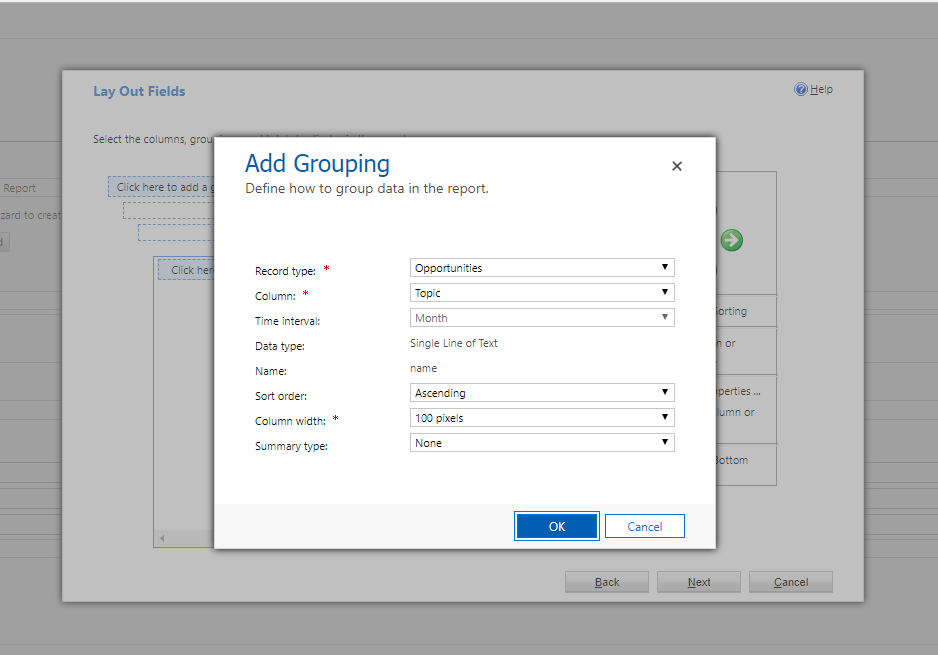
Step 7: Add grouping and columns to display in the report. Select Next
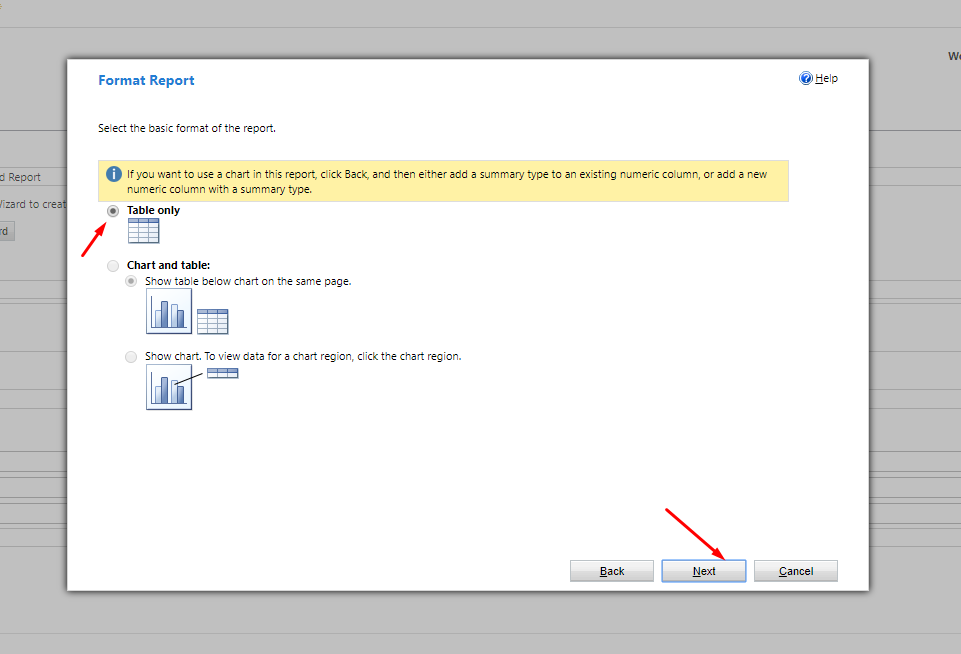
Step 8: Select the basic format of the report. You can define options to view the report in a Table only form or in Chart and Table form. Select Next
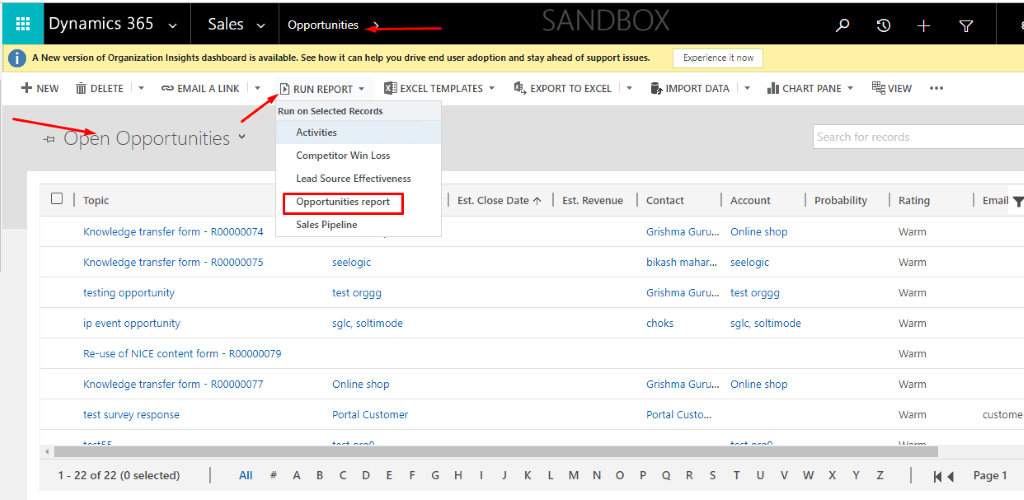
Step 9: After filling out necessary details, go to that entity whose report you have just created. Select the particular view and then click on Run Report option.
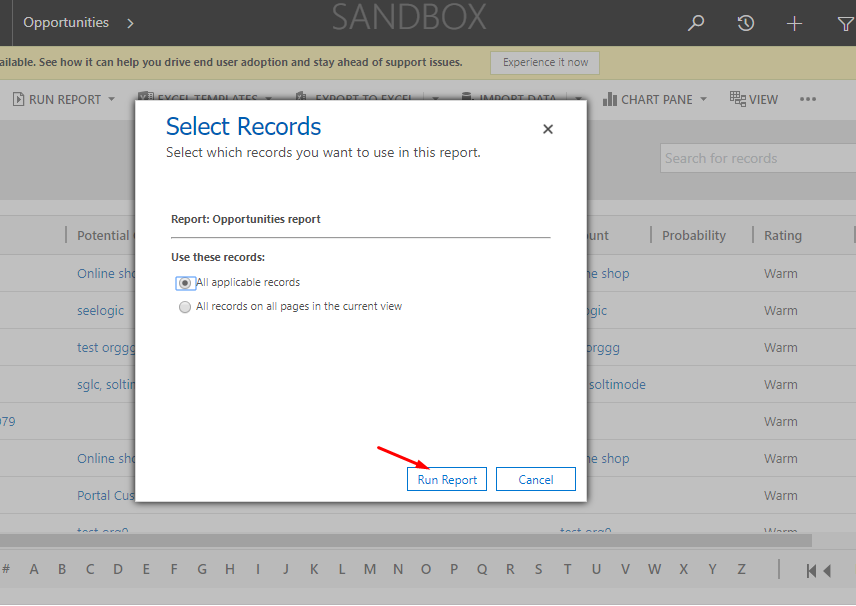
Step 10: Select which records you want to use in this report. Click on Run Report
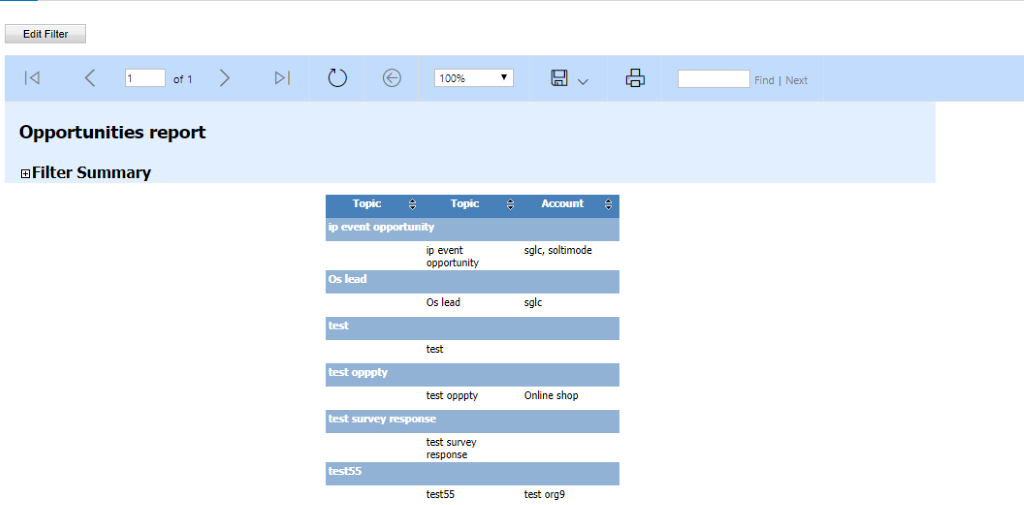
So, this is a great way to quickly create custom reports and communicate specific information as per your requirement. If you have any question regarding Microsoft Dynamics 365 for Sales, Contact us today on 01296 328689. Or email us at info@dogmagroup.co.uk.